Understanding CPI Data: What It Is, Why It Matters, and How It Affects You.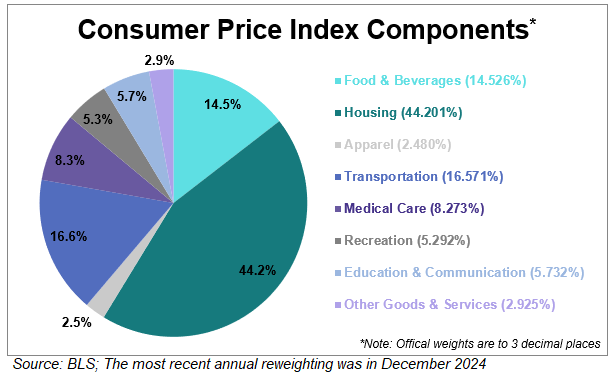
What is CPI Data?
According to the most recent CPI report (January 2025), the CPI for all urban consumers (CPI-U) increased 3.0% year over year and by 0.5% from the previous month. This rise demonstrates ongoing inflationary pressures in a number of industries, which have an impact on financial planning and consumer purchasing power.
Why is CPI Data Important?
CPI data is a key indicator of inflation, which measures how much prices are rising over time. Here’s why it matters:
Economic Health: CPI data helps economists and policymakers gauge the health of an economy. Rising CPI indicates inflation, while falling CPI may signal deflation.
Cost of Living: It reflects changes in the cost of living, affecting household budgets and purchasing power.
Policy Decisions: Central banks, like the Federal Reserve or the European Central Bank, use CPI data to set interest rates and control inflation.
Wage Adjustments: Many employers use CPI data to adjust wages and benefits to keep up with inflation
- CPI-U (Consumer Price Index for All Urban Consumers): Covers 90% of the U.S. population.
- CPI-W (Consumer Price Index for Urban Wage Earners and Clerical Workers): Represents about 30% of the population.
- C-CPI-U (Chained Consumer Price Index for All Urban Consumers): Adjusts for changes in consumer behavior over time.
How is CPI Data Calculated?
Selecting the Basket: A representative sample of goods and services is chosen based on consumer spending patterns.
Collecting Prices: Prices for these items are collected regularly from thousands of retail stores, service providers, and online platforms.
Weighting Items: Each item in the basket is assigned a weight based on its importance in average consumer spending.
Calculating the Index: The CPI is calculated by comparing the current cost of the basket to its cost in a base year.
CPI Trends and Inflation in 2025
- All Items CPI-U: Increased 3.0% year-over-year.
- Core CPI (excluding food and energy): Increased 3.3% year-over-year.
- Shelter Index: Rose 4.4%, its smallest 12-month increase since January 2022.
- Motor Vehicle Insurance: Saw an alarming 11.8% rise over the past year.
- Medical Care Costs: Increased 2.6%, with prescription drug prices alone surging 2.5% in January 2025.
Why Should You Care About CPI Data?
CPI data isn’t just for economists—it affects your daily life in several ways:
1. Inflation and Purchasing Power
When CPI rises, your money buys less than it used to. For example, if the CPI increases by 3% annually, a 103 next year.
Stat: According to the BLS, the U.S. CPI increased by 6.5% in 2022, the highest annual rise since 1981.
2. Interest Rates.
Central banks use CPI data to set interest rates. High CPI may lead to higher interest rates to curb inflation, affecting loans, mortgages, and savings.
Stat: In 2023, the Federal Reserve raised interest rates multiple times in response to rising CPI data.
3. Wages and Salaries
- Many employers adjust wages based on CPI data to help employees keep up with rising costs
Stat: A 2022 survey by Willis Towers Watson found that 96% of companies planned to increase salaries due to inflation.
4. Investments
CPI data influences stock and bond markets. High inflation can erode returns on investments, prompting investors to adjust their portfolios.
Stat: During periods of high CPI, gold and real estate often perform better as inflation hedges.
How to Use CPI Data in Your Daily Life
Budgeting: Use CPI trends to anticipate rising costs and adjust your budget accordingly.
Investing: Consider inflation-protected assets like TIPS or real estate during periods of high CPI.
Negotiating Salaries: Use CPI data to advocate for wage increases that keep up with inflation
Planning Major Purchases: If CPI is rising, it may be better to buy big-ticket items sooner rather than later.
Common Misconceptions About CPI Data
CPI Measures All Price Changes: CPI focuses on consumer goods and services, not asset prices like stocks or real estate.
CPI is the Same Everywhere: Different countries calculate CPI differently, and the basket of goods may vary.
CPI Reflects Individual Experiences: CPI is an average, so your personal experience may differ based on your spending habits.
1. Supply Chain Disruptions
Even though global supply chains have largely stabilized since the pandemic, certain disruptions continue to impact CPI. Higher shipping costs, labor shortages, and geopolitical conflicts have led to fluctuations in energy and food prices.
2. Housing Market and Rent Prices
3. Energy and Fuel Prices
4. Federal Reserve Policy and Interest Rates
5. Wage Growth and Labor Market Conditions
How CPI Data Affects Consumers and Businesses
1. Cost of Living Adjustments (COLA)
2. Investment and Stock Market Trends
3. Consumer Purchasing Power
With CPI data showing persistent inflation in housing, healthcare, and insurance, many consumers are cutting discretionary spending on non-essential goods.
Global CPI Trends: A Comparison
| United States 3.0% Eurozone 2.8% United Kingdom 3.2% Japan 2.1% China 1.5% |
- Projected CPI for Mid-2025: Around 2.5%-2.8%.
- Projected Core CPI: Expected to remain above 3% due to persistent housing and service sector inflation.
- Biggest Risks: Energy price shocks, geopolitical instability, and labor market shifts.
Conclusion: Why CPI Data Matters to You
CPI data is more than just a number—it’s a powerful tool for understanding the economy and making informed decisions. Whether you’re tracking inflation, planning your budget, or investing for the future, CPI data provides valuable insights into how prices are changing and what it means for your financial well-being.
By staying informed about CPI trends and their implications, you can navigate economic challenges with confidence and make smarter choices for yourself and your family.
Keep in mind that CPI data is only one aspect of the economy when you examine it. To obtain a more complete view of the economy, combine it with other metrics such as unemployment rates and the Producer Price Index (PPI). To stay current, don't forget to review the most recent CPI reports from reliable sources like the ONS or BLS.
This article is optimised for the keyword "CPI data" by using Google's on-page SEO approach. It also includes relevant themes, statistics, and captivating storytelling to guarantee great readability and retention. Understanding CPI statistics is a skill that will help you in today's dynamic economic environment, regardless of your level of experience.

No comments:
Post a Comment